Daily Pivot High-Low Marker
Description:
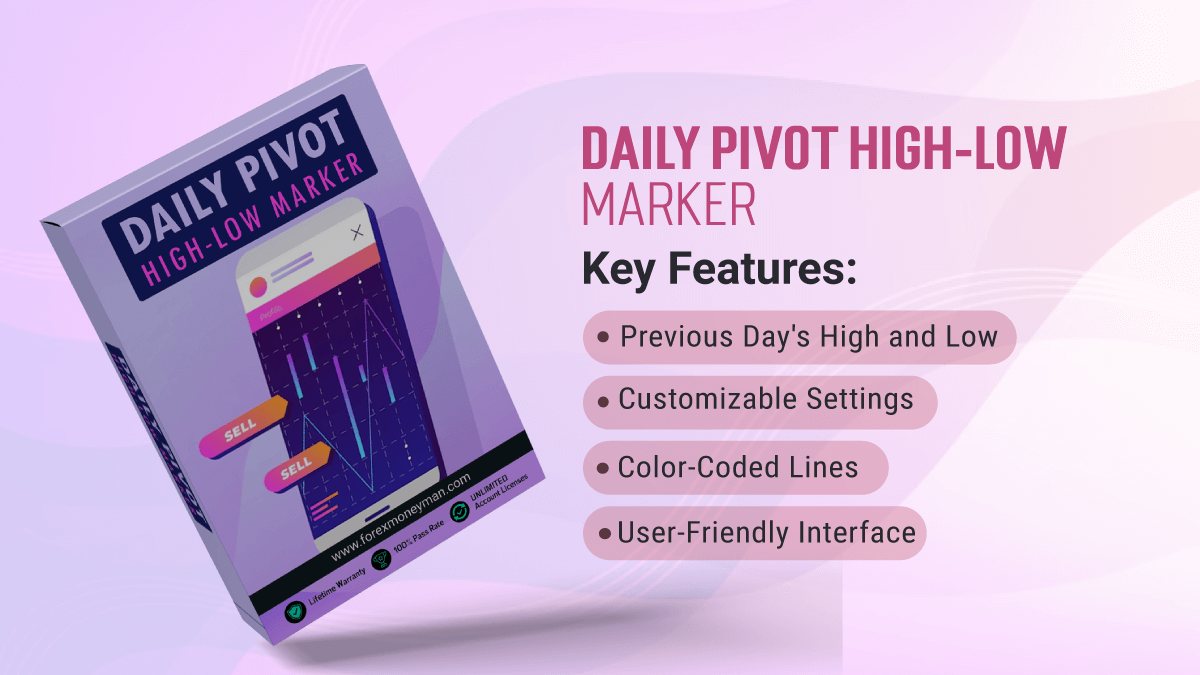
Daily Pivot High-Low Marker is a MetaTrader 4 (MT4) indicator designed to highlight the previous day’s high and low prices directly on the chart. This tool assists traders in identifying significant support and resistance levels, facilitating more informed trading decisions. By providing visual cues, it helps traders anticipate potential price movements and market trends based on past performance.
Key Features:
- Previous Day’s High and Low: Displays horizontal lines representing the high and low prices of the previous trading day.
- Customizable Settings: Traders can easily adjust the number of bars to look back for pivot calculation and the visibility of lines.
- Color-Coded Lines: Distinct colors for high (red) and low (green) lines for easy identification.
- User-Friendly Interface: Simple to install and configure, making it accessible for traders of all levels.
Settings:
Indicator Parameters:
- BarsBack:
-
- Type: Integer
- Description: Number of bars to look back for high and low calculation (default: 8).
- ShowLines:
- Type: Boolean
- Description: Option to show or hide the high and low lines on the chart (default: true).
User Guide:
Installation:
- Download the Indicator: Save the Daily Pivot High-Low Marker .ex4 file to your computer.
- Open MetaTrader 4: Launch your MT4 trading platform.
- Copy the File: Navigate to File > Open Data Folder > MQL4 > Indicators. Copy the downloaded file into this folder.
- Restart MT4: Close and reopen the MT4 platform to recognize the new indicator.
- Add to Chart: Right-click on your chart, select Indicators > Custom > and then choose Daily Pivot High-Low Marker.
How to Use:
- Identify Key Levels: Utilize the high and low lines to identify potential support and resistance levels for the current trading session.
- Plan Trades: Look for price action near these levels to plan entry and exit points in your trading strategy.
- Combine with Other Indicators: Enhance your analysis by using this indicator in conjunction with other technical tools.
FAQ:
Q1: What is the significance of the previous day’s high and low?
- A: These levels often act as critical support and resistance areas, helping traders make informed decisions about entry and exit points.
Q2: Can I adjust the number of bars for calculation?
- A: Yes, you can modify the BarsBack parameter to suit your trading preferences.
Q3: Will the indicator work on any time frame?
- A: While it is designed to show daily high and low, it can be applied to any time frame, but it is most effective on intraday charts.
Q4: How can I hide the lines if I don’t want to see them?
- A: Simply set the ShowLines parameter to false in the indicator settings.
Q5: Is there a limit to how many days back I can calculate?
- A: The BarsBack parameter allows you to set how many bars back to look for the high and low, but it is generally recommended to keep it within a range that reflects the previous day.
Additional Details:
- Version: 1.0
- Compatibility: MT4
- License: Free/Paid (depending on version)
- Support: Contact the developer via email or support forum for assistance.
- Updates: Regular updates will be provided to enhance functionality and address any issues.
Conclusion:
Daily Pivot High-Low Marker is an essential tool for traders aiming to capitalize on market trends by analyzing previous price action. Its straightforward design and customizable settings make it a valuable addition to any trader’s toolkit, aiding in the identification of critical levels for successful trading strategies.